Resolving Event ID 1053 on Windows Server 2012 R2 with DHCP and Multiple NICs

The Problem

The DHCP server on my Windows Server 2012 R2 Essentials domain controller shutdown (Event ID 1054) when I added an additional NIC and plugged it in. The root cause as reported in the event log was an EventID 1053 stating: “The DHCP/BINL service has encountered another server on this network with IP Address, x.x.x.x, belonging to the domain: .”

Background

One of the built-in features to Window’s DHCP server is rogue DHCP server detection. If more than one server on a LAN segment is responding to DHCP requests then all hell breaks loose. By default, when the Windows DHCP server detects a rogue DHCP server, it shuts itself down reporting Event IDs 1053 and 1054.

In my case, I do want the DC’s DHCP server to service requests on one of the LAN segments which is on one of the NICs. However, I have a second NIC that I’m passing through to virtual machines that I do not want the DC to even have an IP address, much less to service DHCP requests. There is a virtual machine running on that LAN segment which is servicing the DHCP requests. The Windows DHCP server however listens for DHCP servicing on all network interfaces. So although the DC’s DHCP has no responsibility to service that scope, for whatever reason, it is still insisting on shutting down in the presence of this other DHCP server. I tried authorizing the other DHCP server, I tried removing the binding to that network, I tried giving it a static IP address on that network and all sorts of other variations. I would expect that there is a proper way to fix this but I was completely unable to determine what that fix is. It may be that the authorization didn’t work because the other DHCP server isn’t a Windows machine or that the Essentials SKU doesn’t support multiple DHCP servers.

Solution

The only solution that I could find that worked was a registry modification to disable rogue DHCP server detection. This is sort of the nuclear option and I would have liked a more elegant solution, but this is what I’ve got.

NOTE: Be sure that this is what you want to do! In most cases, you do not want to do this. You frequently want to adjust your scopes, adjust your bindings, or use DHCP relays/IP helpers and rarely do you ever want to resort to turning off rogue DHCP detection.

  1. Add a new registry value entry to HKEY_LOCAL_MACHINE\SYSTEM\CurrentControlSet\Services\DHCPServer\Parameters of type REG_DWORD named DisableRogueDetection with a value of 0x1
  2. Restart the Windows DHCP server which as been shutting down with EventIDs 1053,1054

Reference

DHCP network interface card bindings
DHCP Binding only to one interface card
Event ID 1053 — DHCP Authorization and Conflicts
DHCP/BINL Service

<span class="entry-utility-prep entry-utility-prep-cat-links">Posted in</span> SysAdmin, VMware, Windows | 1 Comment

Windows 8 Kernel Debugging with KDNET and the Realtek RTL8168

Existing Kernel Debugging Methods

Until Windows 8 there were only five ways to kernel debug a Windows machine:

  1. Local Debugging (e.g. SysInternals LiveKD)
  2. Null-modem cable (a.k.a Serial or COM)
  3. IEEE 1394 (a.k.a. Firewire)
  4. USB 2.0
  5. VirtualKD

Local debugging has serious limitations in that you can’t set breakpoints, view registers or stack traces, and are limited to debugging only those things that happen after the machine is fully booted and a user has logged in. Serial bugging has been a bread and butter method forever, supporting both hardware and virtual machines (via virtualized serial ports) but it’s really really slow. Firewire brought to the table a huge increase in speed over serial while offering fairly straight forward hardware requirements. Firewire virtualization isn’t possible with VMware (that I’m aware of anyways) and Firewire has steadily been dropped from a lot of OEM PCs in favor of USB 2.0 and more recently USB 3.0. Debugging over USB 2.0 is a bit of a unicorn. It’s technically possible to do it, but it requires a specific port on the USB controller that may or may not be available (e.g. it may be wired internally to a webcam or card reader) and a relatively expensive (~$100 USD) USB 2.0 debug cable such as the NET20DC. In practice, USB 2.0 kernel debugging is a gauntlet best avoided if at all possible. SysProg’s VirtualKD is an awesome framework. It has it’s quirks but it’s steadily improved over time. It’s by far the fastest kernel debugging transports in my experience and it’s a snap to install and configure. It’s biggest drawbacks are that it only supports virtual machines and you have to install a driver package (which may not amenable to the machine owner for various reasons).

Windows 8 Introduces Kernel Debugging over a Network Cable

Serial ports and Firewire were disappearing from a significant portion of PCs (laptops, workstations, and servers alike) and there are significant issues with using the USB 2.0 kernel debug transport. Microsoft needed a new efficient and effective means of supplying kernel debug transports to the IHVs and ISVs of the world. With Windows 8 and it’s kernel cousin, Server 2012, Microsoft introduced to the public two more kernel debug transports – Network and USB 3.0. Along with these, Microsoft also introduced new logo certification requirements (WHQL Debug Capability) that required system integrators to pass a series of tests to demonstrate that the system was in fact kernel debuggable. There is a great Channel 9 video released by the team here. It is my understanding that to be logo certified, you don’t have to support any one specific debugging transport, you just have to demonstrate one of them. The video states that one could even satisfy this requirement by using a custom hardware interface and debug cable as long as the hardware and any kernel transport drivers were available to end-users.

Microsoft implemented kernel transport drivers for the two most likely vehicles for providing this: Network and USB 3.0. Network interfaces already are and will continue to be prolific for the foreseeable future. USB 3.0 will continue to increase it’s market saturation and addresses the biggest issues with USB 2.0:

  • You can use any USB 3.0 port to debug
  • The only cable you need is a relatively inexpensive (~$15 USD) USB 3.0 A-A debug cable (i.e. no Vbus pins).
  • Chipset support is standardized via xHCI which is supported by most hardware shipping today

These are not the NICs you are looking for and other Jedi Knight tricks

I recently received a new (Jan 2013) Dell XPS 15 L521x laptop that I needed to develop driver support for. These machines don’t have a serial or Firewire ports and I’m not about to screw around with USB 2.0 debugging. They do however, have both a gigabit NIC and a USB 3.0 controller. Furthermore, they are logo certified, so they must have passed the WHQL Debug Capability tests, most likely with one (or both) of these methods. As I don’t yet have a USB 3.0 A-A debug cable available (or another machine with USB 3.0 ports for that matter), I set out to use the network transport. Checking the PCI hardware ID I could see that the NIC was reporting itself as a Realtek RTL8168. I checked MSDN’s list of supported NICs and saw that the first model listed was the Realtek RTL8168 – yay! I turned off secure boot (a requirement to modify boot options on UEFI machines), fired up BCDEDIT, configured the machine for network debugging, copied the key over to the host machine, fired up the debugger, opened the necessary ports on the firewall, and rebooted the target machine and …. nothing happened. I tried a few more times, got nothing. Checked my firewall and my BCDEDIT configs, still nothing. I verified that my host machine was setup correctly by firing up a Windows 8 VM with a bridged network connection using the same BCEDIT commands and that was working like a charm. I fired up Wireshark to see if the target machine was even sending out packets to try and connect and it was not. I updated the UEFI firmware and every driver on the system with the latest from Dell and still nothing. I tried setting static DHCP reservations for both machines and using the dhcp=no boot option flag, still nothing. Looking back at wireshark I could see that early in the boot process there were IPv6 solicitation packets going out, but nothing for IPv4 (which is the required protocol for kernel debugging) until much later in the boot sequence. Furthermore, these IPv4 packets were only trying to solicit a private 169.254. address.

I continued poking around for several hours, trying different things and searching the Internet for clues. It seemed like I had landed in a barren wasteland, with seemingly no chatter about anything that sounded like my issue. Then I stumbled across this post on the MSDN forums that had two responses – one from the PM on the team that owns the WHQL Debug Capability test (Matt Rolak) and one from a software design engineer on the Windows debugger team (Joe Ballantyne). Matt’s answer said that one possible cause of the OP’s question was:

In some cases machines with 4+GB of RAM don’t work for the NIC debugging (but will if you change the system to less than 4GB). It may be that your board passed their certification test with a different bios or with less RAM and worked around the issue.

The MSDN article on this is here: http://msdn.microsoft.com/en-gb/library/windows/hardware/hh830880 but the key part is:

  • System firmware should discover and configure the NIC device such that its resources do not conflict with any other devices that have been BIOS-configured.
  • System firmware should place the NIC’s resources under address windows that are not marked prefetchable

It seems for some MB’s this isn’t adhered to if they have more than 4GB of RAM configured and try to use NIC debugging. The ‘workaround’ was to reduce the RAM during debugging (less than ideal we know but unless the BIOS is updated by the manufacturer there isn’t another workaround we are aware of at this time).

The machine I was dealing with has 8GB of RAM and Matt’s reply was Jan of this year, so this could possibly be coming into play in my situation. With Dell’s sleek design of the XPS 15 L512x however, removing system memory was more than I felt like dealing with right away. It’s not terrible, but you do have to remove 6 T-5 screws and a couple of philips screws to get the back panel off to access the system memory and I wasn’t ready just yet to start taking the machine apart. Reading on, we see from Joe’s answer (emphasis mine):

I suspect that you have an unsupported NIC in the target machine, and that KDNET on the target machine is attempting to use USB3 debugging, and that you have a MB that has USB3 hardware support, and which also “supports” USB3 debugging. […]

What NIC is in the target machine? If it is a new model Realtek 8168 then it is likely NOT supported. (Unfortunately Realtek keeps their PCI device ID unchanged for many different hardware spins of their chips, and so some 8168 chips are supported and some are not.)

You have got. to. be. kidding me. I double check the PCI device ID for the NIC again and confirm that it is reporting itself as Realtek RTL8168. I go back to the Dell support page to check the driver update details again a notice a key detail – Dell is reporting the Windows 8 network driver update for it’s service tag as a Realtek RTL8111F! I headed over to the Realtek site to see if I could find out specifics about the differences between the RTL8168 and the RTL8111F. The only difference that jumped out to me was the packaging and neither page discussed chipset support with Microsoft’s kernel debug transport. The RTL8111F is definitely not listed as supported on the MSDN list of supported NICs. This would also explain why I wasn’t seeing any IPv4 packets being sent out by the target machine until late in the boot, likely after the Realtek driver had been loaded.

I found this whole ordeal pretty frustrating. It’s frustrating that Realtek is shipping hardware that is reporting the same PCI device ID that have different hardware interfaces such that the Microsoft driver that works for one, doesn’t work at all for the other. Realtek gets away with it for normal use of the NIC because they use the same driver bundle for all the 8168 and 8111 chipsets (along with several others). It’s also frustrating that, given the fact that Microsoft is obviously internally aware of this headache, that their MSDN supported Ethernet NICs page doesn’t have an asterisk on Realtek chip support stating these issues.

Conclusion

At this point, I’m waiting on a USB 3.0 debug cable and a PCI-E USB 3.0 adapter to arrive so I can approach it from that angle. Based on my experience, if you need to kernel debug hardware and you want to utilize the KDNET network transport protocol, I suggest you look towards the Intel and/or Broadcom chipsets if you get to choose. There are far more chipsets listed as supported from those vendors. If you end up with a machine with a Realtek controller, I still can’t tell you a universal way to determine which chipset you actually have and thus if it’s supported, so be prepared for the possibility of failure.

<span class="entry-utility-prep entry-utility-prep-cat-links">Posted in</span> WinDbg, Windows | <span class="entry-utility-prep entry-utility-prep-tag-links">Tagged</span> , , , | 12 Comments

Ghost in the Machine – Debugging an Ornery Windows Bluescreen Problem – Part 2

Collecting Additional Data Points

Continuing where I left off in Part 1, I had identified that the issue was likely either faulty hardware or a bad driver – which pretty much describes the cause of every bugcheck. I was hoping for something a bit more precise. I did have the one mini-dump so I decided to tear into it a little bit more until I could get my hands on a kernel dump.

Deep Dive: Level 2

The first thing I did after loading the crash dump into WinDbg was see what !analyze -v had to say about it:

2: kd> !analyze -v
*******************************************************************************
*                                                                             *
*                        Bugcheck Analysis                                    *
*                                                                             *
*******************************************************************************

SYSTEM_SERVICE_EXCEPTION (3b)
An exception happened while executing a system service routine.
Arguments:
Arg1: 00000000c0000005, Exception code that caused the bugcheck
Arg2: fffff800031842b1, Address of the instruction which caused the bugcheck
Arg3: fffff88007a64ef0, Address of the context record for the exception that caused the bugcheck
Arg4: 0000000000000000, zero.

Debugging Details:
------------------


EXCEPTION_CODE: (NTSTATUS) 0xc0000005 - The instruction at 0x%08lx referenced memory at 0x%08lx. The memory could not be %s.

FAULTING_IP: 
nt!ObpLookupObjectName+461
fffff800`031842b1 f6              ???

CONTEXT:  fffff88007a64ef0 -- (.cxr 0xfffff88007a64ef0)
rax=fffffa80042bccc8 rbx=fffff80002e0f000 rcx=fffff8a00c73af12
rdx=000000000000006c rsi=0000000000000000 rdi=0000000000000001
rip=fffff800031842b1 rsp=fffff88007a658d0 rbp=fffffa80042bcb10
 r8=fffffa8003c6cf30  r9=fffffa8005fec268 r10=fffff8a000004ca0
r11=fffffa80040f6890 r12=0000000000000000 r13=fffff8a000004ca0
r14=0000000000000040 r15=fffff88007a65a40
iopl=0         nv up ei pl nz na po nc
cs=0010  ss=0018  ds=002b  es=002b  fs=0053  gs=002b             efl=00010206
nt!ObpLookupObjectName+0x461:
fffff800`031842b1 f6              ???
Resetting default scope

CUSTOMER_CRASH_COUNT:  1

DEFAULT_BUCKET_ID:  CODE_CORRUPTION

BUGCHECK_STR:  0x3B

PROCESS_NAME:  svchost.exe

CURRENT_IRQL:  0

LAST_CONTROL_TRANSFER:  from fffff800031855f6 to fffff800031842b1

STACK_TEXT:  
fffff880`07a658d0 fffff800`031855f6 : 00000000`00000000 fffffa80`042bcb10 fffffa80`00000000 fffffa80`03d0a260 : nt!ObpLookupObjectName+0x461
fffff880`07a659c0 fffff800`03158d8c : fffff800`03013940 00000000`00000000 fffff8a0`0c445301 00000000`00000005 : nt!ObOpenObjectByName+0x306
fffff880`07a65a90 fffff800`03163ef2 : 00000000`03c9f980 00000000`00020019 00000000`03c9f990 000007fe`00000000 : nt!CmOpenKey+0x28a
fffff880`07a65be0 fffff800`02e8d253 : 00000000`00000008 000007fe`e8425c34 00000000`00000001 00000000`00000000 : nt!NtOpenKey+0x12
fffff880`07a65c20 00000000`771a143a : 00000000`00000000 00000000`00000000 00000000`00000000 00000000`00000000 : nt!KiSystemServiceCopyEnd+0x13
00000000`03c9f938 00000000`00000000 : 00000000`00000000 00000000`00000000 00000000`00000000 00000000`00000000 : 0x771a143a


CHKIMG_EXTENSION: !chkimg -lo 50 -d !nt
    fffff800031842b0 - nt!ObpLookupObjectName+460
	[ 85:95 ]
1 error : !nt (fffff800031842b0)

MODULE_NAME: memory_corruption

IMAGE_NAME:  memory_corruption

FOLLOWUP_NAME:  memory_corruption

DEBUG_FLR_IMAGE_TIMESTAMP:  0

MEMORY_CORRUPTOR:  ONE_BIT

STACK_COMMAND:  .cxr 0xfffff88007a64ef0 ; kb

FAILURE_BUCKET_ID:  X64_MEMORY_CORRUPTION_ONE_BIT

BUCKET_ID:  X64_MEMORY_CORRUPTION_ONE_BIT

Followup: memory_corruption
---------

So we have a one-bit memory corruption that has overwritten code in the nt module. Besides the nice bucket id to key us into this, we can also see it in the disassembly. We know that the f6 instruction has decoded into an invalid instruction, so the code corruption must be right before or right after that instruction. If we disassemble starting just before the faulting IP in the crash we get this:

2: kd> u nt!ObpLookupObjectName+0x457
nt!ObpLookupObjectName+0x457:
fffff800`031842a7 488bb42428010000 mov     rsi,qword ptr [rsp+128h]
fffff800`031842af 4895            xchg    rax,rbp
fffff800`031842b1 f6              ???
fffff800`031842b2 0f8544060000    jne     nt!ObpLookupObjectName+0xaac (fffff800`031848fc)
fffff800`031842b8 b801000000      mov     eax,1
fffff800`031842bd 488d942490000000 lea     rdx,[rsp+90h]
fffff800`031842c5 440fb6c8        movzx   r9d,al
fffff800`031842c9 458bc6          mov     r8d,r14d

Going to a known good copy of the same OS (Windows 7 x64 SP1) and disassembling that same location, we get this:

1: kd> u nt!ObpLookupObjectName+457
nt!ObpLookupObjectName+0x457:
fffff800`02bc6357 488bb42428010000 mov     rsi,qword ptr [rsp+128h]
fffff800`02bc635f 4885f6          test    rsi,rsi
fffff800`02bc6362 0f8544060000    jne     nt!ObpLookupObjectName+0xaac (fffff800`02bc69ac)
fffff800`02bc6368 b801000000      mov     eax,1
fffff800`02bc636d 488d942490000000 lea     rdx,[rsp+90h]
fffff800`02bc6375 440fb6c8        movzx   r9d,al
fffff800`02bc6379 458bc6          mov     r8d,r14d
fffff800`02bc637c 498bcd          mov     rcx,r13

Ignoring the different addresses due to the different module base addresses, we can see that the second instruction is incorrect. The xchg rax, rbp; ??? should be a test rsi,rsi. Looking at the code bytes, we should have 0x4885f6 but instead we have 0x4895f6. There’s the single-bit corruption!

Let’s Try Throwing Money at the Problem

This was another strike in the faulty hardware column for me. The next thing I did was have them run the built-in Windows Memory Diagnostic Tool. I had them configure it to use the Extended test with Default caching and an unlimited number of passes. I was hoping for an easy win at this point because RAM is cheap and easy to install. After about an 18 hrs test run however, nothing had shown up. The next thing I tried as a CPU stress-test using Prime95 to see if the CPU was flaking out when it heated up. I had them use the ‘Blend’ setting which uses lots of RAM in addition to stressing the CPU and 4 threads since the machine is a 4 Core i5 750 which lacks hyperthreading. After running for a few hours it will still running strong without any signs of trouble.

Going back to my last visit when I cleaned the case out, the video card was the only thing that had a significant amount of dust on it. Video cards make heavy use of RAM and use DMA so a fault in the hardware could result in direct corruption of physical memory that would appear to show up in random places in the virtual address space of the kernel and processes on the system. This fact plus the lack of a good GPU diagnostic tool led me to just order them a Radeon HD 6450 to replace their existing ATI Radeon HD 4350. I’ve also had several of those same ATI Radeon HD 4350 cards from the same manufacturer die on me at work as well, which further added to my suspicion. A few days later it arrived and they installed it. All seemed to be well for a couple of weeks and I was beginning to think we had nipped this one. Apparently the machine had other plans though, as it crashed yet again.

Deep Dive: Level 3

Having previously enabled kernel crash dumps, I was now armed with both a mini-dump and a kernel memory dump for this latest crash. Zipped, the kernel memory dump was only 144MB which was easily uploaded to me overnight, even on the slow DSL connection. I once again started off with !analyze -v:

3: kd> !analyze -v
*******************************************************************************
*                                                                             *
*                        Bugcheck Analysis                                    *
*                                                                             *
*******************************************************************************

PAGE_FAULT_IN_NONPAGED_AREA (50)
Invalid system memory was referenced.  This cannot be protected by try-except,
it must be protected by a Probe.  Typically the address is just plain bad or it
is pointing at freed memory.
Arguments:
Arg1: fffff8800764a6c0, memory referenced.
Arg2: 0000000000000001, value 0 = read operation, 1 = write operation.
Arg3: fffff960006b9eca, If non-zero, the instruction address which referenced the bad memory
	address.
Arg4: 0000000000000000, (reserved)

Debugging Details:
------------------


Could not read faulting driver name

WRITE_ADDRESS:  fffff8800764a6c0 

FAULTING_IP: 
cdd+9eca
fffff960`006b9eca 48898c2490000000 mov     qword ptr [rsp+90h],rcx

MM_INTERNAL_CODE:  0

CUSTOMER_CRASH_COUNT:  1

DEFAULT_BUCKET_ID:  VISTA_DRIVER_FAULT

BUGCHECK_STR:  0x50

PROCESS_NAME:  OUTLOOK.EXE

CURRENT_IRQL:  0

TRAP_FRAME:  fffff8800744a4a0 -- (.trap 0xfffff8800744a4a0)
NOTE: The trap frame does not contain all registers.
Some register values may be zeroed or incorrect.
rax=fffff900c0151020 rbx=0000000000000000 rcx=0000000000000060
rdx=fffff8800744aa50 rsi=0000000000000000 rdi=0000000000000000
rip=fffff960006b9eca rsp=fffff8800744a630 rbp=fffff8800744a6e0
 r8=0000000000000001  r9=fffff8800744af50 r10=fffff900c0151080
r11=fffff8800744a6e0 r12=0000000000000000 r13=0000000000000000
r14=0000000000000000 r15=0000000000000000
iopl=0         nv up ei pl nz na pe nc
cdd+0x9eca:
fffff960`006b9eca 48898c2490000000 mov     qword ptr [rsp+90h],rcx ss:0018:fffff880`0744a6c0=fffff8800744aa50
Resetting default scope

LAST_CONTROL_TRANSFER:  from fffff80002e8deec to fffff80002ee5fc0

STACK_TEXT:  
fffff880`0744a338 fffff800`02e8deec : 00000000`00000050 fffff880`0764a6c0 00000000`00000001 fffff880`0744a4a0 : nt!KeBugCheckEx
fffff880`0744a340 fffff800`02ee40ee : 00000000`00000001 fffff880`0764a6c0 fffff6fc`80610800 fffff880`0744aa50 : nt! ?? ::FNODOBFM::`string'+0x4514f
fffff880`0744a4a0 fffff960`006b9eca : 00000000`00000000 fffff880`0744ab70 fffff900`c0145020 fffff900`c1daf9c8 : nt!KiPageFault+0x16e
fffff880`0744a630 00000000`00000000 : fffff880`0744ab70 fffff900`c0145020 fffff900`c1daf9c8 00000000`0000056a : cdd+0x9eca


STACK_COMMAND:  kb

FOLLOWUP_IP: 
cdd+9eca
fffff960`006b9eca 48898c2490000000 mov     qword ptr [rsp+90h],rcx

SYMBOL_STACK_INDEX:  3

SYMBOL_NAME:  cdd+9eca

FOLLOWUP_NAME:  MachineOwner

MODULE_NAME: cdd

IMAGE_NAME:  cdd.dll

DEBUG_FLR_IMAGE_TIMESTAMP:  0

FAILURE_BUCKET_ID:  X64_0x50_cdd+9eca

BUCKET_ID:  X64_0x50_cdd+9eca

Followup: MachineOwner
---------

This bugcheck is different from the last one we’ve got, but we’ve seen that this machine has been issuing bugcheck 0x50 stop codes via the Windows Event Logs I investigated in Part 1. The faulting IP this time is in cdd.dll, which is the Microsoft Canonical Display Driver. Although the bugcheck name is PAGE_FAULT_IN_NONPAGED_AREA, we can see that our current IRQL is 0 (Passive) where page faults are allowed. This indicates that the reference memory address is invalid. We can see that it was a write operation to fffff8800764a6c0 and that the faulting IP was fffff960006b9eca. Viewing the trap frame to see the disassembly of the faulting instruction and the current values of the registers, we see this:

3: kd> .trap 0xfffff8800744a4a0
NOTE: The trap frame does not contain all registers.
Some register values may be zeroed or incorrect.
rax=fffff900c0151020 rbx=0000000000000000 rcx=0000000000000060
rdx=fffff8800744aa50 rsi=0000000000000000 rdi=0000000000000000
rip=fffff960006b9eca rsp=fffff8800744a630 rbp=fffff8800744a6e0
 r8=0000000000000001  r9=fffff8800744af50 r10=fffff900c0151080
r11=fffff8800744a6e0 r12=0000000000000000 r13=0000000000000000
r14=0000000000000000 r15=0000000000000000
iopl=0         nv up ei pl nz na pe nc
cdd+0x9eca:
fffff960`006b9eca 48898c2490000000 mov     qword ptr [rsp+90h],rcx ss:0018:fffff880`0744a6c0=fffff8800744aa50

Hrmn! All this instruction is trying to do is write the value of rcx to a stack location and it’s essentially access violating. A buffer overrun is one way this can occur, but you generally don’t see that with a static stack offset. Let’s check the math on this calculation:

rsp=fffff8800744a630
rsp+90 => fffff8800744a630 + 90 => fffff8800744a6c0

So the address of the stack write should be fffff8800744a6c0 however we see from argument one of the bugcheck that it was fffff8800764a6c0. Viewing these in 64-bit binary representation we see:

fffff8800744a630 (correct calculation)
1111 1111 1111 1111 1111 1000 1000 0000 0000 0111 0100 0100 1010 0110 1100 0000
fffff8800764a630 (actual access attempt)
1111 1111 1111 1111 1111 1000 1000 0000 0000 0111 0110 0100 1010 0110 1100 0000
                                                    ^

Notice that bit 21 is incorrectly set in the actual access attempt. We have another single-bit memory corruption!

At this point I am a bit puzzled. In my experience, CPU failures are generally pretty rare and if the CPU is going to go bad, it does so very early on (this machine is >3yrs old). I’ve already replaced the video card. I’m leaning towards this being a faulty RAM issue although it could be a motherboard issue. However, from my recollection from my computer organization courses in college, the way that move instruction is going to execute is that that the arithmetic logic unit (ALU) will get the value from the RSP register, add 90, and then directly pass the resulting address to the memory-management unit (MMU) via its select lines, indicating a write operation and the value in RCX. The various processor caches (L1, L2, L3, etc.) are of course involved but the main point is that I don’t recall main system memory (RAM) being involved in the calculation of the write address. The address of the fault is a virtual address and the output from the MMU to the RAM should be a physical address. Said another way, although RAM is the target of the write, I don’t recall there being any RAM access required to lookup the target address. The only things I could think of were:

  1. During the hardware assisted conversion of the virtual address to a physical address, the various structures (PXE, PDE, PTE,PFN) weren’t present in the translation look-aside buffer (TLB) which resulted in a page walk, introducing RAM accesses which presents an opportunity for the target address to be corrupted.
  2. The problem isn’t RAM at all, but the motherboard or CPU or Power Supply Unit (PSU) or ….

Let’s Throw Some More Money at the Problem

Motherboards are fairly pricey, especially OEM boards and they are difficult for the average joe to replace. The CPU in this machine is a Core i5 750 which is still plenty fast for what they need. However, it’s the old LGA 1156 form factor, which they don’t make anymore. As a result, getting a replacement processor was going to be $200 and it’s still difficult for the average joe to replace. So, although the last memory test didn’t show anything, I went ahead and ordered 2 4GB DIMMS to replace the existing 4 1GB DIMMS.

Driver Verifier

I also noticed a few drivers on the system that I didn’t recognize or that have been known to cause issues in the past (based on various Google searches). Windows has a built-in utility called Driver Verifier. Per MSDN – “Driver Verifier monitors kernel-mode drivers to detect incorrect function calls or actions that might corrupt the system.” I went ahead and had them enable Driver Verifier using the standard settings on the following list of drivers:

  1. 000 – Associated with Cyberlink Power DVD. Fishy module name most likely associated with DRM.
  2. mcupdate – McAfee update service. McAfee isn’t installed on the box.Update: After looking at the loaded drivers in Process Explorer, the full name of this module mcupdate_GenuineIntel.dll and it’s the Intel Microcode Update Library from Microsoft Corporation
  3. ElbyCDIO – VirtualClone drive
  4. VClone – VirtualClone drive
  5. fowp64 – This one is really fishy. It’s a driver that injects into every process and hooks file accesses. It has a corresponding user-mode service and is part of something called FileOpen Manager Service. Google searches are turning up very little and it’s installed into it’s own Program Files directory so I don’t know what application it’s associated with.
  6. rikvm – Associated with Cyberlink Power DVD. Google searches turn up a lot of talk of this being a rootkit and people being unhappy with Cyberlink about it
  7. psi_mf – Associated with Secunia PSI
  8. pnarp – Associated with Cisco Pure Networks
  9. k57nd60a – Broadcom Ethernet Driver

Wait and See

Now that I have still have kernel crash dumps enabled, Driver Verifier turned on, the video card replaced, all the drivers and applications fully updated, and some new RAM on the way, it’s time to just wait and see. Hopefully the new RAM takes care of the issue in which case I’ll update this post with a “Hooray!”. If not, then it will be on to Part 3. Until then….

Update 2013-03-08:Within 12hrs of installing the new ram, the machine bug checked 3 times. All the new bug checks point at single bit memory corruption. Going back to the mov qword ptr [rsp+90h],rcx with a stuck bit, I just can’t see how this could be anything other than the CPU. At this point I’m hunting eBay for a Core i5-750 LGA 1156 to give that a go. More when it’s available….

Update 2013-06-13:After swapping out the processor almost 4 months ago, there have been zero crashes. Looks like we finally got this one beat!

<span class="entry-utility-prep entry-utility-prep-cat-links">Posted in</span> CrashDumps, WinDbg, Windows | <span class="entry-utility-prep entry-utility-prep-tag-links">Tagged</span> , , , | 3 Comments

Ghost in the Machine – Debugging an Ornery Windows Bluescreen Problem – Part 1

Background

I’ve been helping a family member figure out why their computer keeps crashing off and on for several months. The machine was just over 3 years old when it started having issues. It’s a Dell Studio XPS 8000 that otherwise has been rock solid until this point. During a previous visit I replaced the hard drive and upgraded the OS from Windows Vista x64 to Windows 7 x64 via a clean install. The machine case has been cleaned inside and outside periodically, is relatively free of dust, and has adequate ventilation. None of the case fans or CPU fans show signs of failure. The video card fan was pretty dusty and sometimes squeaked, but seemed to settle down after a little bit of canned air.

When the crashes first started in October 2012, I went through the usual deal. I checked the Event Log to see if anything jumped out as the culprit in the logs, and nothing did. In fact there was neither a BugCheck (Event ID 1001) entry or a minidump and the Kernel-Power (Event ID 41) entry had 0 for all it’s bugcheck info. I determined what the most recently installed program that had a driver was and uninstalled it, with no effect. I then updated all the drivers on the machine, updated the BIOS, and used Secunia’s PSI to make sure the OS and all it’s applications were fully up to date.

The crashes continued to happen periodically – sometimes multiple times a day, sometimes not for several days. To up the difficulty level, the machine is located thousands of miles away on a rather slow DSL line.

Deep Dive: Level 1

Since I didn’t have physical access to the machine, I was going to have to be resourceful to get the information I need to start debugging this. The first thing I tried was using Fog Creek’s Copilot to remote to the machine and poke around. I’ve generally found Copilot to work very well for me when I’m providing remote assistance. However, triaging a machine over a 768Kbps DSL line with latency north of 300ms ultimately proved painful. Certain operations like scrolling through the Event Viewer logs are just brutal to screen diffing algorithms. I switched up tactics and I had them install Microsoft’s Sysinternals Suite, run Autoruns and Process Explorer, and export both of their results for me. I also had them export the Application and System logs from Event Viewer so that I could view them on my local machine. Unfortunately, almost all of the crash dumps had already been auto-submitted to Microsoft and purged from the file system. The one crash dump that was still around was a mini-dump so I went ahead and enabled kernel memory dumps so that any future crash would be captured with more (hopefully useful) information.

My initial inspection of the single mini-dump didn’t yield any obvious answer (more on that in Part 2), so I started looking at the event log. There had been 36 Kernel-Power (Event ID 41) events in a two month period (October 9th – December 9th 2012). If you view the Details tab of the event properties, you can see the bugcheck code and parameters. The vast majority of the 36 events were BugCheckCode 0 with a PowerButtonTimestamp of 0. This indicates either a hard hang of the machine or a power outage. (Had the machine been powered off by using the power button, you generally get a PowerButtonTimestamp value). The 8 events that did have BugCheckCode entries had several different stop conditions as shown below. NOTE:Rather annoyingly, EventID 41 displays the stop code in decimal, not hex. I’ve put the hex value in [] next to the decimal value for clarity.

1x Bugcheck 80  [0x50] (0xfffff80022fb4fe0, 0x0, 0xfffff80002e5586b, 0x2)
1x Bugcheck 59  [0x3B] (0xc000001d, 0xfffff9600007a7e0, 0xfffff8800716df50, 0x0)
1x Bugcheck 194 [C2]   (0x7, 0x109b, 0x4323440, 0xfffffa8003649c70)
2x Bugcheck 209 [D1]   (0x0, 0x2, 0x8, 0x0)
1x Bugcheck 30  [1E]   (0xffffffffc000001d, 0xfffff80002f00c29, 0x0, 0xfffffa8005476c00)
1x Bugcheck 80  [0x50] (0xfffff12014be480c, 0x1, 0xfffff8800121899d, 0x7)
1x Bugcheck 59  [0x3B] (0xc0000005, 0xfffff800031842b1, 0xfffff88007a64ef0, 0x0)

There were also 8 BugCheck (Event ID 1001) events in that time frame:

11/05/2012 3:21:23 PM  The bugcheck was: 0x00000050 (0xfffff80022fb4fe0, 0x0000000000000000, 0xfffff80002e5586b, 0x0000000000000002).
11/16/2012 10:16:35 AM The bugcheck was: 0x0000003b (0x00000000c000001d, 0xfffff9600007a7e0, 0xfffff8800716df50, 0x0000000000000000).
11/18/2012 4:39:51 PM  The bugcheck was: 0x000000c2 (0x0000000000000007, 0x000000000000109b, 0x0000000004323440, 0xfffffa8003649c70). 
11/18/2012 4:41:38 PM  The bugcheck was: 0x000000d1 (0x0000000000000000, 0x0000000000000002, 0x0000000000000008, 0x0000000000000000). 
11/30/2012 12:09:51 AM The bugcheck was: 0x000000d1 (0x0000000000000000, 0x0000000000000002, 0x0000000000000008, 0x0000000000000000). 
12/02/2012 3:47:26 PM  The bugcheck was: 0x0000001e (0xffffffffc000001d, 0xfffff80002f00c29, 0x0000000000000000, 0xfffffa8005476c00). 
12/06/2012 1:33:05 PM  The bugcheck was: 0x00000050 (0xfffff12014be480c, 0x0000000000000001, 0xfffff8800121899d, 0x0000000000000007). 
12/09/2012 5:17:29 PM  The bugcheck was: 0x0000003b (0x00000000c0000005, 0xfffff800031842b1, 0xfffff88007a64ef0, 0x0000000000000000). 

Nothing initially jumped out at me because the stop codes varied and I didn’t have any crash dumps to correlate them with. I started working through the stop code documentation for each event to see if there was some commonality.

Stop Code 0xC2

I could see by the timestamps on the two events with stop code 0xC2 (one Event ID 41 and one Event ID 1001) were referring to the same event. I referred to the MSDN documentation and the bugcheck parameters to see what type of violation had occurred. The answer is a double free: “The current thread attempted to free the pool which was already freed”. The address it was trying to double free was 0xfffffa8003649c70 and it’s pool header contents were: 0x0000000004323440. Using a kernel debugging session in WinDbg on a Windows 7 x64 target machine, we can see that what a pool header looks like:

1: kd> dt nt!_POOL_HEADER -v
struct _POOL_HEADER, 9 elements, 0x10 bytes
   +0x000 PreviousSize     : Bitfield Pos 0, 8 Bits
   +0x000 PoolIndex        : Bitfield Pos 8, 8 Bits
   +0x000 BlockSize        : Bitfield Pos 16, 8 Bits
   +0x000 PoolType         : Bitfield Pos 24, 8 Bits
   +0x000 Ulong1           : Uint4B
   +0x004 PoolTag          : Uint4B
   +0x008 ProcessBilled    : Ptr64 to struct _EPROCESS, 138 elements, 0x4d0 bytes
   +0x008 AllocatorBackTraceIndex : Uint2B
   +0x00a PoolTagHash      : Uint2B

Therefore, taking the pool header as a quadword (0x0000000004323440) we get it’s sequence of bytes as (in hex): 40 34 32 04 00 00 00 00. Placing these into the _POOL_HEADER fields, we get:

PreviousSize: 0x40
PoolIndex: 0x34
BlockSize: 0x32 (size of allocation is thus 0x320 or 0n880)
PoolType: 0x4 (session pool)
PoolTag: 0x00000000

I was hoping for a PoolTag value there to help point me in the correct direction, but alas, dead end. I also tried searching the session pool for allocations of size 0x320 on one of my Windows 7 x64 VMs but didn’t turn up anything interesting. What we do know is that the double free can be caused by either a faulty driver or memory corruption and thus our problem could be either.

Stop Code 0xD1

I turned my attention next to the 0xD1 stop code. The MSDN documentation states that this occurs when a page fault occurred at an IRQL too high (>= DISPATCH_LEVEL). Parameter 1 is the memory referenced, Parameter 2 is the IRQL at the time of the reference, Parameter 3 is the access type (read, write, or execute) and Parameter 4 is the address that referenced the memory. Applying that to these bugchecks we see:

0x000000d1 (0x0000000000000000, 0x0000000000000002, 0x0000000000000008, 0x0000000000000000)
Memory Referenced: 0x0 (NULL)
Current IRQL: 0x2 (DISPATCH_LEVEL)
Operation: 0x8 Execute
Faulting Address: 0x0

At first glace it looks like we a NULL pointer dereference in a function at the NULL page, which doesn’t make sense. Referring back to the MSDN page though we see:

If the first parameter has the same value as the fourth parameter, and the third parameter indicates an execute operation, this bug check was likely caused by a driver that was trying to execute code when the code itself was paged out. Possible causes for the page fault include the following:

  • The function was marked as pageable and was running at an elevated IRQL (which includes obtaining a lock).
  • The function call was made to a function in another driver, and that driver was unloaded.
  • The function was called by using a function pointer that was an invalid pointer.

This seems to indicate that a faulty driver is the most likely cause of this bugcheck, although it’s plausible that memory corruption lead to this error as well.

Stop Code 0x3B

Moving on to the 0x3B stop code, I again refer to the MSDN documentation. Applying this info along with the documentation on NTSTATUS values to the 0x3B bugcheck here we have:

0x0000003b (0x00000000c000001d, 0xfffff9600007a7e0, 0xfffff8800716df50, 0x0000000000000000)
Exception: 0xC0000001D (STATUS_ILLEGAL_INSTRUCTION) – {EXCEPTION} Illegal Instruction An attempt was made to execute an illegal instruction.
Faulting Address: 0xfffff9600007a7e0
Exception Context Record (CXR): 0xfffff8800716df50

Since I don’t have a crash dump for this one, I can’t be sure. However, in my experience session specific drivers like win32k.sys and cdd.sys are generally loaded into the 0xfffff960’00000000 address range (vs. the 0xfffff880’00000000 and 0xfffff800’0000000 range that system-wide drivers are loaded into). I haven’t found any documentation on this behavior. Assuming that the address that caused this exception was in a Microsoft driver like win32k.sys or cdd.dll, it’s very unlikely that there is an illegal instruction bug in the code. Rather, this is more likely memory code corruption from a bad driver, a bad device using DMA, or bad memory.

Stop Code 0x1E

Next up was the 0x1E stop code. Glancing at it’s documentation we get:

0x0000001e (0xffffffffc000001d, 0xfffff80002f00c29, 0x0000000000000000, 0xfffffa8005476c00)
Exception Code: 0xC0000001D (STATUS_ILLEGAL_INSTRUCTION) – {EXCEPTION} Illegal Instruction An attempt was made to execute an illegal instruction.
Exception Address: 0xfffff80002f00c29
Parameter 0 of Exception: 0x0
Parameter 1 of Exception: 0xfffffa8005476c00

So a few things here. First of all, I believe that the first parameter translates to STATUS_ILLEGAL_INSTRUCTION because NTSTATUS values are 32-bits even on 64-bit architectures, so since 0xC0000001D is a negative number, it’s sign-extending the value to 0xffffffffc000001d. Second is that in my experience, modules like nt and hal get loaded in the 0xfffff800`00000000 range. Again, it seems unlikely that nt or hal would have an illegal instruction bug in them. The MSDN documentation for 0x1E speaks quite a bit about hardware issues and faulty device drivers and recommends you run a memory test. It also mentions a BIOS issue. However, back in October when I was first triaging this issue, I updated the BIOS and the release notes didn’t mention any issues that sounded related to this. Since the crashes occurred both before and after the upgrade, it’s unlikely that it is the cause here.

Stop Code 0x50

The final stop code in the list is 0x50. Taking a gander at the MSDN page we again see discussion about faulty hardware:

Bug check 0x50 usually occurs after the installation of faulty hardware or in the event of failure of installed hardware (usually related to defective RAM, be it main memory, L2 RAM cache, or video RAM).
Another common cause is the installation of a faulty system service.
Antivirus software can also trigger this error, as can a corrupted NTFS volume.

For completeness sake, the particular 0x50 bugchecks we had were:

0x00000050 (0xfffff80022fb4fe0, 0x0000000000000000, 0xfffff80002e5586b, 0x0000000000000002)
Memory Referenced: 0xfffff80022fb4fe0
Operation: 0x0 (Read)
Faulting Address: 0xfffff80002e5586b (likely nt or hal module)

0x00000050 (0xfffff12014be480c, 0x0000000000000001, 0xfffff8800121899d, 0x0000000000000007)
Memory Referenced: 0xfffff12014be480c
Operation: 0x1 (Write)
Faulting Address: 0xfffff8800121899d (unknown)

That 0xfffff12014be480c looks suspicious to me, because in my experience, I don’t see many memory allocations in the 0xfffff120’00000000 range.

Where to next?

Now that I had exhausted the bugcheck information from the Windows Event Logs and still didn’t have a clear answer, where do I head next? Stay tuned for Part 2 where I start digging into the crash dumps in more detail.
<span class="entry-utility-prep entry-utility-prep-cat-links">Posted in</span> CrashDumps, WinDbg, Windows | <span class="entry-utility-prep entry-utility-prep-tag-links">Tagged</span> , , , , | Leave a comment

BSOD When Installing Windows 7 Checked Build with VMWware Workstation 7

The Blue Screen of Death

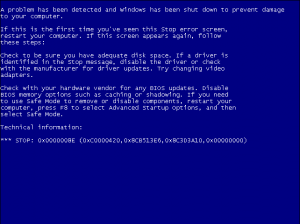
I was creating a Windows 7 VM using the checked build and during the OS installation process I was treated to the following BSOD: STOP: 0x0000008E (0xC0000420,0x8CB513E6,0x8C3D3A10,0x0000000)

Windows 7 x86 Checked Build VMWware BSOD

The TLDR Fix

Add the following to the virtual machine’s configuration file (.vmx):

piix4pm.smooth_acpi_timer = "TRUE"

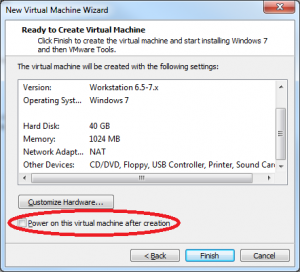
Also, when creating the virtual machine using the “New Virtual Machine Wizard”, be sure to uncheck the box on the last step called “Power on this virtual machine after creation” so that you have the opportunity to edit the vmx file before installation begins.

VMWare - New Vitual Machine Wizard

Digging Deeper

I tried rebooting a few times and each time resulted in BSOD with the same stop code and exception code. The stop code 0x0000008E corresponds to the Bug Check code 0x8E which is KERNEL_MODE_EXCEPTION_NOT_HANDLED. From the MSDN article we can see the 4 values after the stop code are:

  1. the exception code that was not handled
  2. the address where the exception occurred
  3. the trap frame
  4. and a reserved parameter

Looking in the Ntstatus.h from the WDK we can see that exception code 0xC0000420 is STATUS_ASSERTION_FAILURE.

So why is a checked build of Windows throwing an assertion when installed inside of VMWare Workstation? A quick google searched turned up this recommendation. I was a bit curious as to what the piix4pm.smooth_acpi_timer option was and why an ACPI timer would be causing kernel driver crashes on checked builds but not free builds of Windows. I found this VMWare Knowledge Base article on this issue for Windows Vista and Server 2008 which sheds some light on it. The PIIX4 acronym refers to the Intel PCI ISA IDE Xcelerator (which wikipedia calls the Intel IDE ISA Xcelerator for some reason). From page 2 of this this Intel datasheet:

The 82371AB PCI ISA IDE Xcelerator (PIIX4) is a multi-function PCI device implementing a PCI-to-ISA bridge
function, a PCI IDE function, a Universal Serial Bus host/hub function, and an Enhanced Power Management
function.

It goes on to say (emphasis mine):

PIIX4 supports Enhanced Power Management, including full Clock Control, Device Management for up to
14 devices, and Suspend and Resume logic with Power On Suspend, Suspend to RAM or Suspend to Disk. It
fully supports Operating System Directed Power Management via the Advanced Configuration and Power
Interface (ACPI)
specification. PIIX4 integrates both a System Management Bus (SMBus) Host and Slave
interface for serial communication with other devices.

So it appears that the default behavior of the ACPI abstraction in VMWare workstation occasionally violates timer reads which doesn’t play nicely with the hal!HalpGenerateConsistentPmTimerRead assertion in checked builds of Windows. To understand why the guest OS relies on these timer reads and the challenges a virtual machine faces in providing them see “Timekeeping in VMWare Virtual Machines”. The fix is to turn on the smooth_acpi_timer option which I can’t seem to find anymore documentation on.

For what it’s worth, I am running VMware Workstation 7.1.5 build-491717 and using the en_windows_7_debug_checked_build_dvd_x86_398742.iso from MSDN.

<span class="entry-utility-prep entry-utility-prep-cat-links">Posted in</span> VMware, Windows | <span class="entry-utility-prep entry-utility-prep-tag-links">Tagged</span> | Leave a comment

Customizing your WinDbg Workspace and Color Scheme

My Eyes! The Goggles Do Nothing!

WinDbg is a great tool for kernel and application debugging. Unfortunately, out of the box it also has a pretty useless workspace layout and (imho) a terrible color scheme. There are several themes that ship with it, if you look in the themes subdirectory of where the Debugging Tools are installed (e.g. C:\Program Files\Debugging Tools for Windows (x64)\themes). There is a also a themes.doc file that provides a bit of background on loading workspaces as well as providing screenshots of the provided workspaces.

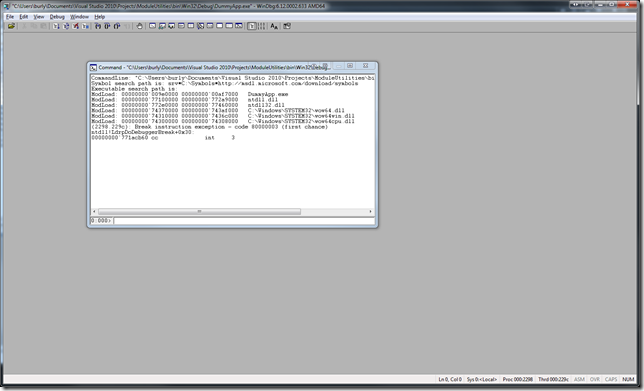
Default WinDbg Workspace

I’m personally a big fan of dark color schemes as I find black-on-white strains my eyes after hours of staring at the monitor, even with the brightness and contrast levels adjusted. What I really want in WinDbg is a color scheme closer to what I use for Visual Studio with a layout most similar to another great debugger, OllyDbg. None of the provided workspaces come even close to what I want. I did some searching around but other than this article, I came up empty on any helpful content.

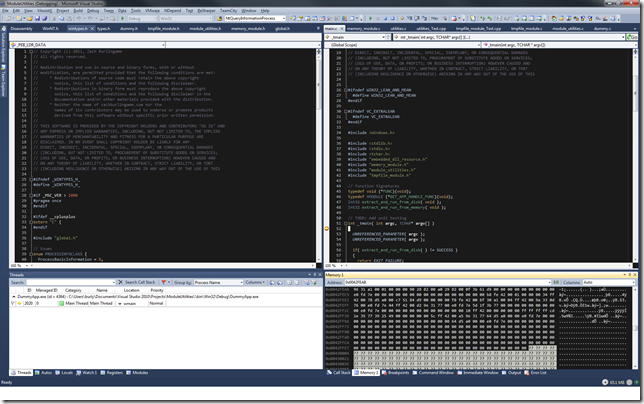
VS2010 Color Scheme - Debugging

Understanding WinDbg Workspaces

The workspace includes the displayed windows, the window positions, font, color scheme, open files, register order, source file directory, symbol file directory, image file directory, and probably a few other tidbits that I’m forgetting.

WinDbg breaks the workspaces out into four types – Dump, Explicit, Kernel, and User. Dump is used when you are debugging a dump file, explicit is when you create an custom workspace for a specific project (i.e. explicitly), kernel is for kernel debugging, and User is for …. regular user applications. WinDbg stores the settings for each of these types of workspaces in a matching registry key located under HKCU\Software\Microsoft\Windbg\Workspaces. In each of these keys is a binary value named “Default”. Additionally, there is an over-arching binary value named “Default” in the top-level Workspaces key. As far as I can tell, the top-level Default values are used for any workspace type but are superseded by any values in the nested keys. In practice however, I found it infuriating trying to determine exactly which inheritance style would be used between the two levels. As a result, I filled in values for everything in one of the workspaces and then just copied the “Default” value to each of the other four locations so that they were identical.

Customizing Your Workspaces

I first start by deleting any existing HKCU\Software\Microsoft\Windbg\Workspaces key (back it up first if you want to be able to restore what you had). Then I open WinDbg and add all the windows I wish to see. Once I get them laid out how I want, I edit the Font and Colors. Since I was basing the color scheme off an existing one, I found it easiest to take the 10 or so different colors and add them all to the custom colors palette for the process first. NOTE: The custom color palette does NOT persist beyond a restart of the application! Once you have the color palette, it’s just a matter of walking through each of the objects and selecting one of the existing colors. Once I’ve settled on the layout and color scheme, I select File->Save Workspace As… and use the name Default. Finally, I copy the Default binary value from the sub-key that was just created under HKCU\Software\Microsoft\WinDbg\Workspaces and copy it to the remaining four locations. Then it’s just a matter of exporting the Workspaces key to a file. It’s rather tedious but once you get this done once, you just import the registry key on any machine where you want to use WinDbg.

Final Results

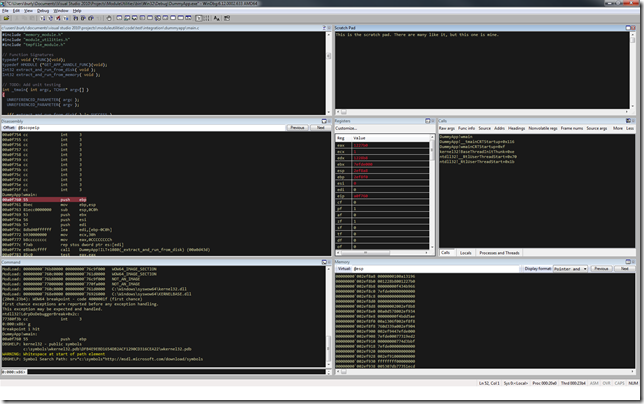
This is ultimately what I came up with. It’s not perfect but it “feels” familiar enough to me that I’m happy with it. Getting here though, was a real chore. If you want my registry key for this settings, you can get it here. Note that this registry key contains some path information that is specific to my machine (e.g. source path) that’ll need to update once you install the key on your machine.

WinDbg Dark Color Scheme

<span class="entry-utility-prep entry-utility-prep-cat-links">Posted in</span> Native, WinDbg, Windows | <span class="entry-utility-prep entry-utility-prep-tag-links">Tagged</span> , , , , , | 8 Comments

Using Mercurial over HTTPS with TeamCity

Uh oh, it’s b0rked

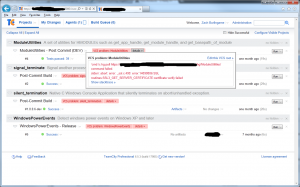
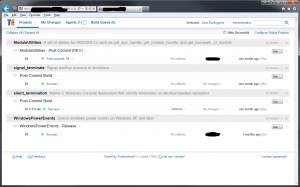
I use Mercurial as my VCS for all my personal projects and JetBrains TeamCity for my build server. Naturally, I need TeamCity to talk to the VCS. There are two basic ways you can serve Mercurial repos: over HTTP(S) using something like hgweb.cgi and over SSH. I use SSH with public key authentication for all of my development boxes and it works great. However, SSH public key auth requires that I have a full-blown shell account on the VCS server. I really didn’t want to have a shell account dedicated for the TeamCity user, so I preferred using HTTPS. Starting with 1.6.4, Mercurial began (smartly) verifying SSL certificates. This coupled with my use of self-signed certificates caused me to get errors in TeamCity from Mercurial when it was trying to pull from the VCS server:

‘cmd /c hg pull https://mercurial.mydomain.com/hg/ModuleUtilities’
command failed.
stderr: abort: error: _ssl.c:490: error: 14090086:SSL
routines:SSL2_GET_SERVER_CERTIFICATE:certificate verify failed

Teamcity Mercurial Error

Teamcity Mercurial Error

Ahh, I think I know what’s going on here…

The fix for this actually fairly simple: add the self-signed cert to the trusted chain. The tricky bit however, is that Mercurial doesn’t use the Windows certificate store so adding an entry like you would for say, Internet Explorer, won’t work. Instead, Mercurial uses a cacert.pem file. For these instructions, I’m using TortoiseHg as my Mercurial client on the build server. The basic concept however, applies regardless of the specific client so it should be fairly easy to adapt to your environment.

A Walk-through the park

The first step is to get the necessary certificate information. I did this by browsing to the URL of one of the repositories in Internet Explorer. For example:

https://mercurial.mydomain.com/hg/myrepo

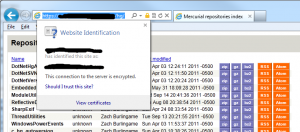
Once there, I clicked on the “Security Report” lock icon next to the URL and selected “View Certificates”.


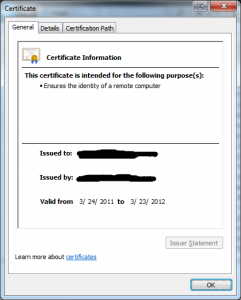
Which brings up a window like this:
View Certificate

View Certificate


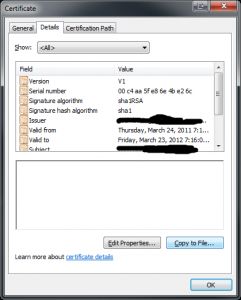
You then click on the “Details” tab and select “Copy to File”:
View Certificate - Copy to File

View Certificate - Copy to File


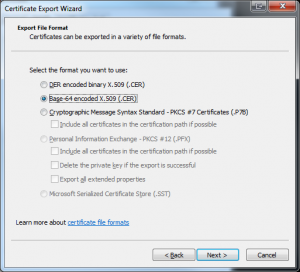
In the “Certificate Export Wizard”, it’s important that you select the “Base-64 encoded X.509(.CER)” format as this is the format used by the cacert.pem file.
Certificate Export Wizard

Certificate Export Wizard


Then it’s simply a matter of going to the TeamCity build server and opening the cacert.pem located in

C:\Program Files\TortoiseHg\hgrc.d\cacert.pem

and adding a name for the cert followed by the contents of the .cer saved in the previous step. For example:

mercurial.mydomain.com
=======================
—–BEGIN CERTIFICATE—–
MIICWjCCAcMCAgGlMA0GCSqGSIb3DQEBBAUAMHUxCzAJBgNVBAYTAlVTMRgwFgYDVQQKEw9HVEUg
Q29ycG9yYXRpb24xJzAlBgNVBAsTHkdURSBDeWJlclRydXN0IFNvbHV0aW9ucywgSW5jLjEjMCEG
A1UEAxMaR1RFIEN5YmVyVHJ1c3QgR2xvYmFsIFJvb3QwHhcNOTgwODEzMDAyOTAwWhcNMTgwODEz
MjM1OTAwWjB1MQswCQYDVQQGEwJVUzEYMBYGA1UEChMPR1RFIENvcnBvcmF0aW9uMScwJQYDVQQL
Ex5HVEUgQ3liZXJUcnVzdCBTb2x1dGlvbnMsIEluYy4xIzAhBgNVBAMTGkdURSBDeWJlclRydXN0
IEdsb2JhbCBSb290MIGfMA0GCSqGSIb3DQEBAQUAA4GNADCBiQKBgQCVD6C28FCc6HrHiM3dFw4u
sJTQGz0O9pTAipTHBsiQl8i4ZBp6fmw8U+E3KHNgf7KXUwefU/ltWJTSr41tiGeA5u2ylc9yMcql
HHK6XALnZELn+aks1joNrI1CqiQBOeacPwGFVw1Yh0X404Wqk2kmhXBIgD8SFcd5tB8FLztimQID
AQABMA0GCSqGSIb3DQEBBAUAA4GBAG3rGwnpXtlR22ciYaQqPEh346B8pt5zohQDhT37qw4wxYMW
M4ETCJ57NE7fQMh017l93PR2VX2bY1QY6fDq81yx2YtCHrnAlU66+tXifPVoYb+O7AWXX1uw16OF
NMQkpw0PlZPvy5TYnh+dXIVtx6quTx8itc2VrbqnzPmrC3p/
—–END CERTIFICATE—–

Save the file and then in a minute or so (by default the VCS check interval for TeamCity is 60s) you should see big smiles from TeamCity (or at least no more VCS errors)!

Teamcity Mercurial over HTTPs

Teamcity Mercurial over HTTPs

<span class="entry-utility-prep entry-utility-prep-cat-links">Posted in</span> Continuous Integration, SysAdmin, Version Control, Windows | <span class="entry-utility-prep entry-utility-prep-tag-links">Tagged</span> | 4 Comments

Setting a Debug Breakpoint in a Win32 API in Visual Studio

Recently, I was stress-testing an application of mine and noticed that the handle count kept growing. After a quick check in Process Explorer I saw that the handle was for a registry key. I was curious as to where the key was being opened in the first place but, it wasn’t in my code so I couldn’t just set a breakpoint on a line in my source. Wouldn’t it be nice if you could set a breakpoint on a function in Visual Studio but that’s not in your code?

You can! If you have the NT symbols loaded for your system, then you can set a breakpoint on any public function. In my particular case, I set a breakpoint on RegOpenKey and RegOpenKeyEx for both ANSI and UNICODE versions of the function.

{,,Advapi32.dll}_RegOpenKeyA@12
{,,Advapi32.dll}_RegOpenKeyW@12
{,,Advapi32.dll}_RegOpenKeyExA@20
{,,Advapi32.dll}_RegOpenKeyExW@20

Note that you have to use the decorated name of the function. For Win32 API functions, you have to put an underscore before the function name and remember that many functions are macro redirected to ANSI or UNICODE versions with an A or W extension. Since most functions use the __stdcall calling convention the @<number> is generally 4x the number of arguments. So for RegOpenKey for example, it’s redirected to RegOpenKeyA or RegOpenKeyW and has 3 arguments, so it’s decorated name is _RegOpenKeyA@12 and _RegOpenKeyW@12.

Similarly, you can set breakpoints in third-party libraries for public functions which assumes that you have a PDB for it.

UPDATE 2011-11-13: You only have to use the decorated name of the function for 32-bit applications. For 64-bit applications, the names are undecorated, like this:

{,,Advapi32.dll}RegOpenKeyA
{,,Advapi32.dll}RegOpenKeyW
{,,Advapi32.dll}RegOpenKeyExA
{,,Advapi32.dll}RegOpenKeyExW

Related: Can I Add a Breakpoint on CreateProcess in VS

<span class="entry-utility-prep entry-utility-prep-cat-links">Posted in</span> Native, Visual Studio | 3 Comments

Setting the sticky bit recursively on directories only

This is more of a reminder for me.

Several times recently I’ve run into problems where files in a MultiUser Mercurial repository on a linux host are getting the wrong group permissions. If you properly set the group sticky bit when you first setup the repo, you won’t have this issue. To fix the issue, I needed to set the sticky bit on every directory in the .hg/store directory recursively.

find /path/to/.hg/store/ -type d -exec chmod g+s {} \;

<span class="entry-utility-prep entry-utility-prep-cat-links">Posted in</span> Linux, SysAdmin | <span class="entry-utility-prep entry-utility-prep-tag-links">Tagged</span> , | Leave a comment

HTTP File Download Reassembly in WireShark with Chunked Transfer Encoding

I was having problems with binaries I was downloading with a particular application the other day. As part of the debugging process at one point, I was taking packet captures with Wireshark inside the client LAN, at the client router’s WAN, and tcpdump from the server. I was then reassembling the file from the stream in each packet capture and comparing them to see where the corruption was occurring relative to the copy that resided on the server.

To accomplish this, I was going to the HTTP GET message packet in Wireshark. Then I would right-click on the packet and select Follow Stream. Next I would select only the direction of traffic from the server to the client (since this was a download). Then I would make sure RAW was selected and save the file. Finally I would open the file up in a hex editor, remove the HTTP header that winds up prepended to the file, and save it. Annnnd then the file was corrupted.

Doing a binary diff of a valid copy of the file with the reconstructed file using 010 Editor I could see that the only differences were several small sections of the file with values like these spaced throughout the file:

Hex: 0D 0A 31 30 30 30 0D 0A
ASCII: \r\n1000\r\n

and one of these at the end of the file:

Hex: 0D 0A 00 00 0D 0A
ASCII: \r\n00\r\n

I confirmed that each of the packet captures at the various points along the way all had the same result. Where the heck was this random data getting injected into my stream and better still, why?!

The first clue that it wasn’t truly random data was the \r&#92n values. Carriage Return – Line Feed (CRLF) is a staple demarcation value in the HTTP protocol. My second clue was that the values were typically 1000 and 0. Although respresented with ASCII codes in the file, if you interpret them as hex they are 4096 and 0. When doing buffered I/O a 4K buffer is very common as is getting a 0 back from a read function when you reach EOF.

As it turns out, the particular behavior I was seeing was a feature of the HTTP/1.1 Protocol called Chunked Transfer Encoding. The wikipedia article does a great job explaining it, but basically it allows for content to be sent prior to knowing the exact size of that content. It does this by prepending the size to the each chunk:

The size of each chunk is sent right before the chunk itself so that a client can tell when it has finished receiving data for that chunk. The data transfer is terminated by a final chunk of length zero.

Ah-ha! So my naïve manual file reconstruction from the Wireshark packet capture of the HTTP download was flawed. Or was it? I checked the file on disk and sure enough it too had these extra data values present.

Once again, Wikipedia to the rescue (emphasis mine):

For version 1.1 of the HTTP protocol, the chunked transfer mechanism is considered to be always acceptable, even if not listed in the TE request header field, and when used with other transfer mechanisms, should always be applied last to the transferred data and never more than one time

The server was utilizing chunked transfer encoding but the application I was using wasn’t fully HTTP/1.1 compliant and was thus doing a naïve reconstruction just like me! So, if you find yourself doing file reconstruction from packet captures of HTTP downloads, make sure you take chunked transfer encoding into account.

<span class="entry-utility-prep entry-utility-prep-cat-links">Posted in</span> Linux, SysAdmin, Windows | 1 Comment